Sometimes grading assessments can be frustrating, depressing, and a mystery or a combination of all of these. Whether we give quick assessments, exit slips, or lengthy tests, it is so important that we analyze the results and let that drive our instruction. But, that is easier said than done. On this post, I will share the steps I take and the printable I use when analyzing student work in math.

Overview
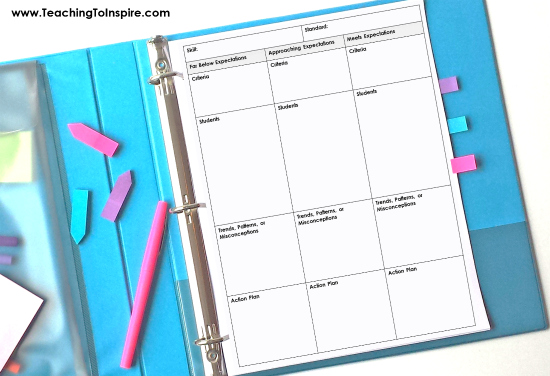
There are five main areas I look at when analyzing student work and each area has it own section on the printable.
- Standard/Skill Being Assessed
- Criteria for Each Grading Scale
- Students
- Trends, Patterns, and Misconceptions
- Action Plan
Now, let’s look at each section and an example analysis I completed using division.
Skill Being Assessed
What is the skill you are assessing? Be as specific as possible and ensure your assessment is assessing that skill.
Example: Multi-Digit Division by 1-Digit Divisors
Criteria for Each Grading Scale
The grading scales will vary based on your needs, your students, and your report card scoring. For my example, I used the following grading scale on my 3 question computation quiz:
Far Below Expectations – 0 correct
Approaching Expectations – 1-2 correct
Meets Expectations – 3 correct or 2 correct with a small computation error
Knowing my criteria for each level or scale helped me quickly score and group my students.
Students with Quick Notes
As I scored the assessments, I added the students in to their specific level. I also analyzed each student’s work and jotted down quick notes about what I noticed that kept them from moving to the next level or what they already know that was helping them at their current level.
Here are some examples:
- Student (small computation errors)
- Student (lost understanding at the end with remainders)
- Student (used multiple strategies)
Jotting down the quick notes is important because it will help you in the next section and ultimately in your future instruction on that skill.
Trends, Patterns, or Misconceptions
Remember the quick notes from the students section? I look over those notes for patterns, trends, and misconceptions among the students in that level.
Here are my examples from each level:
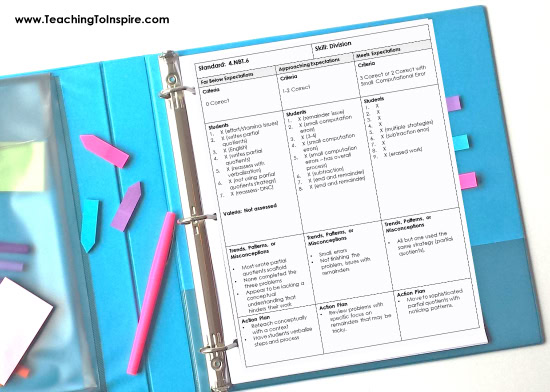
Far Below Expectations: Most wrote partial quotients scaffold, none completed the three problems, appear to be lacking a conceptual understanding that hinders their work
Approaching Expectations: Small errors, not finishing the problem, issues with remainders
Meets Expectations: All but one used the same strategy (partial quotients).
Action Plan
Now, you will pull it all together and create an action plan for further instruction using the data. If you notice a small number of students doing the same error or having the same misconception, that is a small group. If you notice a trend or pattern among most of your students, that is a mini-lesson topic that you should plan. Most of the time you will find that your students are already grouped based on how they did on the assessment and the analysis will tell you what you need to do next with that group.
Far Below Expectations: Reteach conceptually with a context, Have students verbalize steps and process
Approaching Expectations: Review problems with specific focus on remainders that may be tricky and attending to precision.
Meets Expectations: Move to sophisticated partial quotients with noticing patterns.
Example Completed Form
Here is an example completed form with the student names removed for privacy. The completed form is also available in the download so you can see it up close and print it as a reference.
Click here or on the image below to grab the form I use so you can repeat this process with your students’ work. It is not editable but I have included a few different versions to hopefully make this work for everyone.



Leave a Comment